

TIMELINE
2021
ROLE
Product Design Lead
Company
Enigma
COLLABORATORS
Jon Kantrowitz (VP of Product Design), Daniel Ocando (Senior Product Designer), Scott Steinberg (Cheif Product Officer), Charles Zhu (VP of Product), Madeline Ross (VP of Product), Liam Cain (Software Engineer), Ezzy Sriram (Software Engineer), Whitman Schorn (Software Engineer), Eytan Schindelhaim (Lead PM), Erika Scoby (Product Manager)
PROJECT SCOPE
User research, customer interview, UX brainstorming, Stakeholder reviews, UX/UI design and prototyping, QA with developers throughout 2-week based sprints
Enigma is a B2B DAAS (Data as a Service) company that provides data intelligence on small and medium-sized businesses (SMBs) in the United States. Enigma collects and analyzes millions of datasets from diverse data sources to provide health and business insights about SMBs, which was particularly crucial during the pandemic when many small businesses' economic health was impacted. For financial institutions and companies to assess loan qualifications, they need to understand the whole story and signals of an SMB, not just surface-level information. Enigma helps fill the gaps in understanding SMBs by providing deeper data-driven insights.

Project Overview
Collaborating with Enigma team, we designed a seamless, connected top-of-funnel data onboarding experience across Enigma's marketing website, console, and developer docs. This enabled customers to discover our data attributes and use cases in context, and try them out via self-serve UX features in Console, as well as Enigma's Businesses API. The implementation of this onboarding experience improved the overall user experience and helped customers (data buyers) better understand our data offerings. By making our data more accessible, we were able to increase engagement and adoption of our data product.

Customer Research and UX Design
To begin with, we did a holistic user research to identify customer needs and understand their journey to evaluate and purchase small businesses data.
Defining customer journey steps clear helped us understand how digital user experience across website, console, and docs can help provide what they need to explore and evaluate Enigma’s datasets.


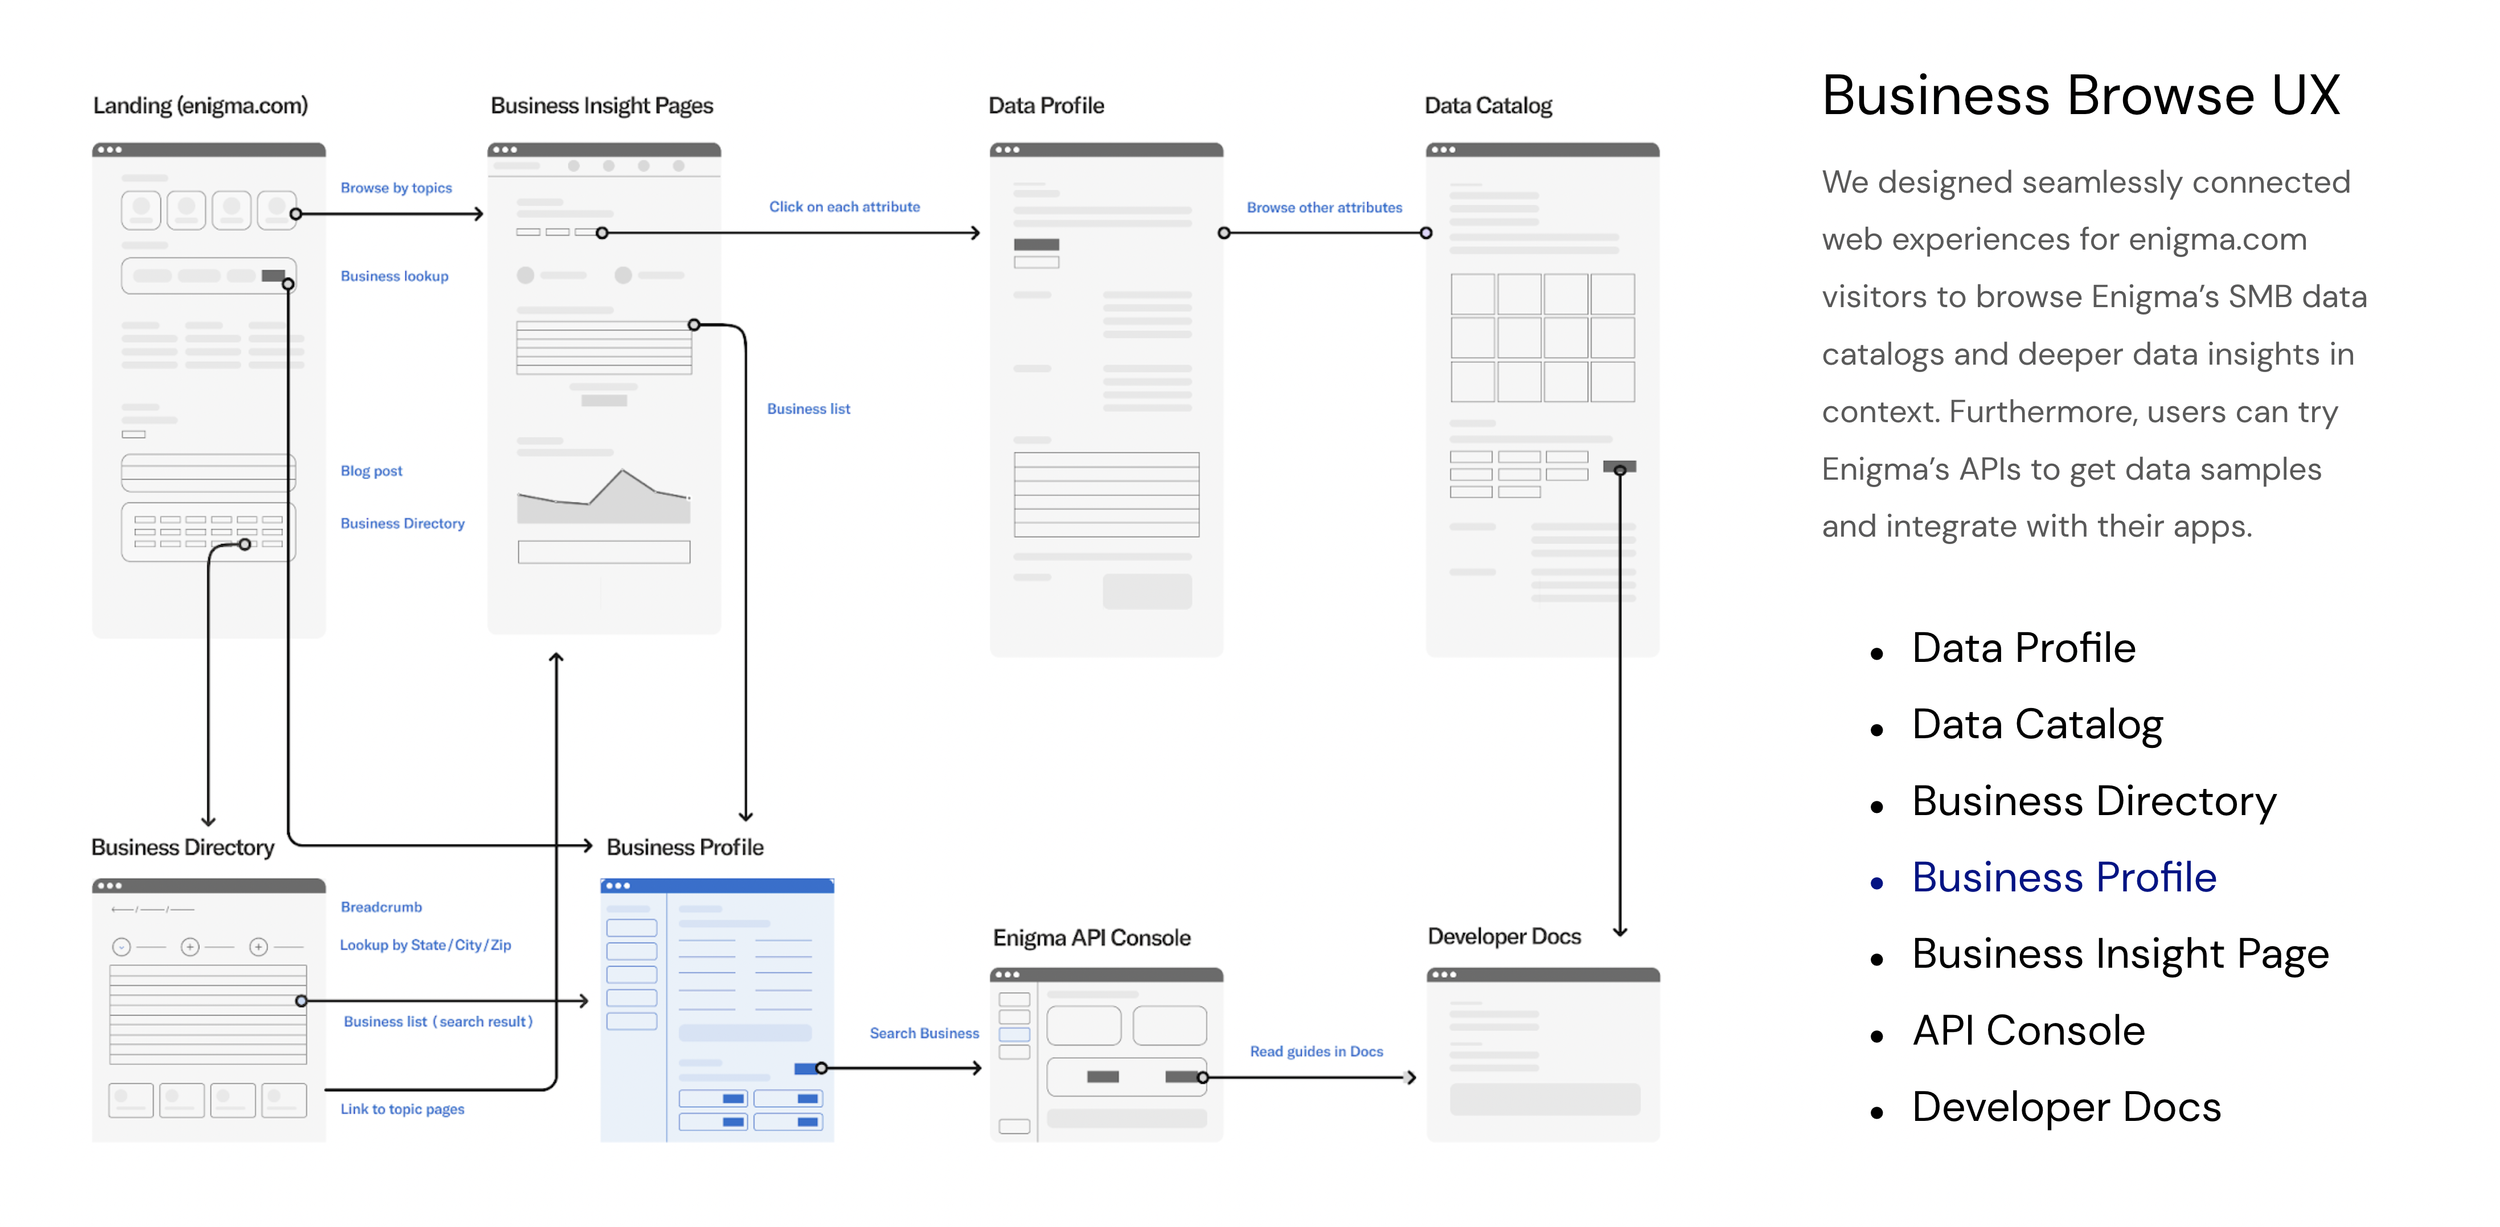

Enigma’s Business Profile feature allows customers to search and explore Enigma’s data-driven insights about US businesses.
Each business profile on Enigma provides not only basic information about the business such as website, year founded, and addresses, but also more detailed insights into the business's revenue, growth, identity signals, and risk level. Additionally, users can explore similar companies based on location and industry.
As the Product Design Lead, I spearheaded the UX design of these rich business profiles and data visualizations, overseeing the entire process from initial research to final UX/UI design, hand-off, and development QA collaborating with a VP of Product Design and others.

UX Challenges
How might we create a frictionless lookup experience for our users to find insights of businesses?
How might we create a seamless search experience powered by Enigma businesses API?
How might we show users the details of data in a comprehensible, and elegant way?
How might we highlight key insights from our business data?
How might we create a seamless conversion path for users to purchase the dataset after getting interested in specific business data?
How might free-trial users navigate to this user experience in Enigma Console? How would the experience be different for paying users?
Target Customers
Enigma Business Profile is designed for two primary types of users: Data Buyers and Business Evaluators who are already familiar with Enigma and want to evaluate the data Enigma has to offer, and Risk Analysts and Marketers who are researching their target customers or loan prospects.
The Data Buyers and Business Evaluators are responsible for underwriting and assessing a business's risk, or for engaging with the right small and medium-sized businesses (SMBs) for their marketing and sales campaigns. They may access Enigma's website and API Console dashboard without the need to talk to sales. When in sales discussions, they often request a sample of data or a snapshot of the data experience. The Enigma Business Profile feature is designed for these users, allowing them to explore Enigma's data about small businesses in pilot and free-trial modes before committing to becoming customers.
The second type of user, Risk Analysts and Marketers, arrives at the public business profile page, sees that Enigma covers a particular business, and then creates an account to view the actual data for that business. These users are not technical.
Their roles include Product Manager, Business Analyst, Manager, Director of Risk, Manager of Risk, Loan Officers, Director of Marketing/demand generation/customer acquisition.
How do we communicate insights from Enigma’s SMB data to our target customers?
Revenue and Growth
Business Identity Signals
Risk and Distress Signals
Other Businesses in the similar industry or location


