
Smart Starbucks
Project Timeline | May 2016
Categories | Data Visualization, UX
Tools | Rstudio, Illustrator, Sketch
Team | Personal Project
How might data visualization and UX help people make a healthier choice on the spot?

While you’re waiting in line at Starbucks or any other coffee shop, you may have an internal debate of… “should I order frappuccino or americano?”
You may crave more sugar depending on the mood on the spot and go for pumpkin spice latter without knowing the nutritional facts.
This project is to help customers make healthier choices using data visualization.
The idea of Smart Starbucks is to help people make smarter and easier decisions when they choose what to drink by getting a personalized suggestion based on your mood and nutrition facts such as calories, fat, fiber, sugars in comparison.
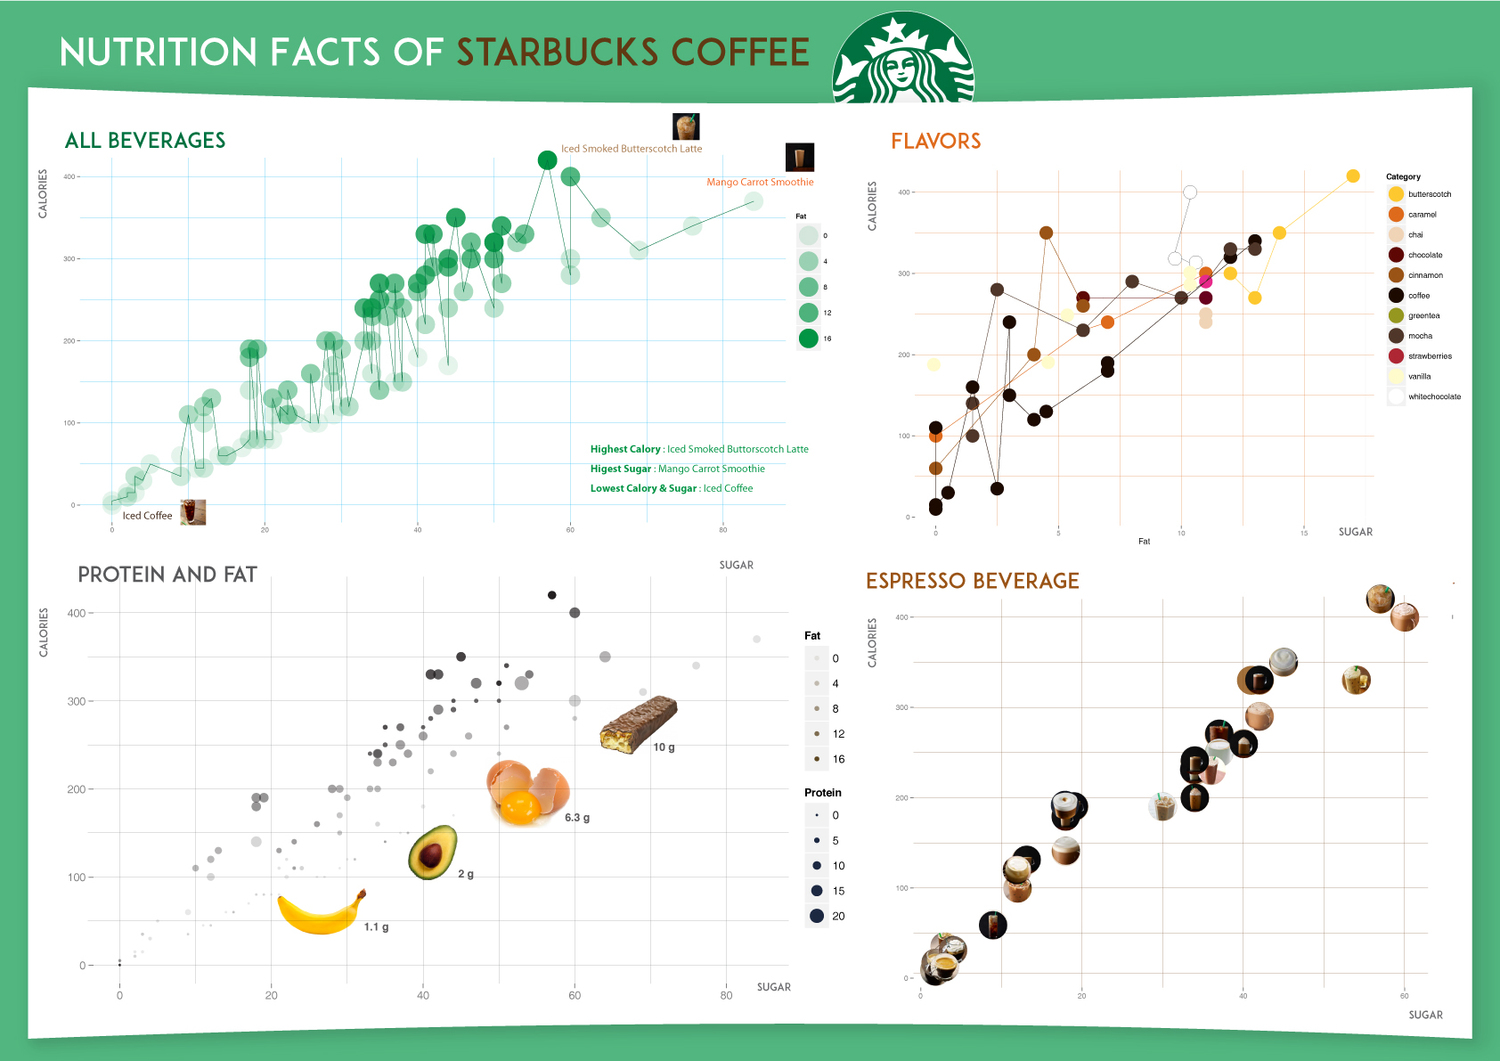
Dataset used: Calories, Fat, Protein, Sugar in the Starbucks drinks.

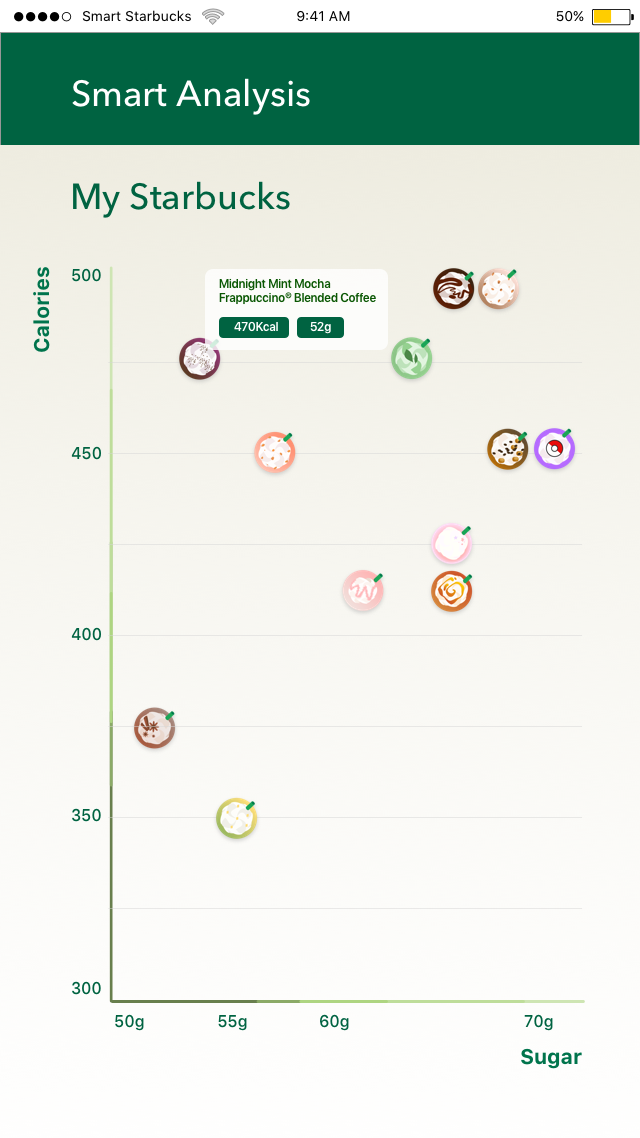
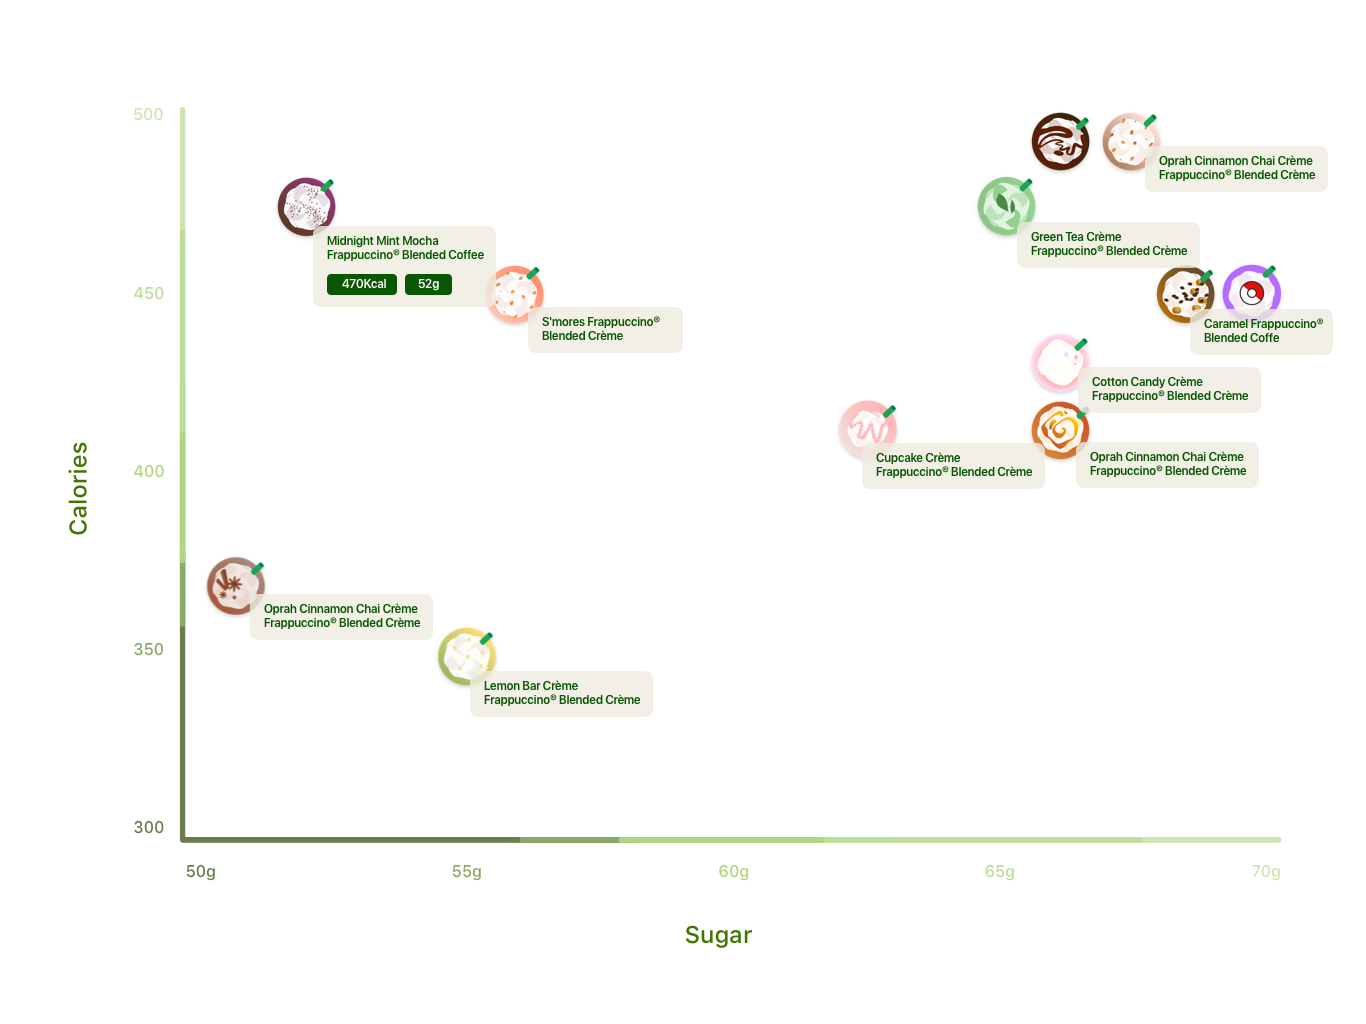
As a visual design idea for data charts, I designed custom icons to each dot for user to quickly get them at a glance on the plot. Also, when hovering over each visual, users will see the beverage's name and detailed nutrition facts about calories and sugars.
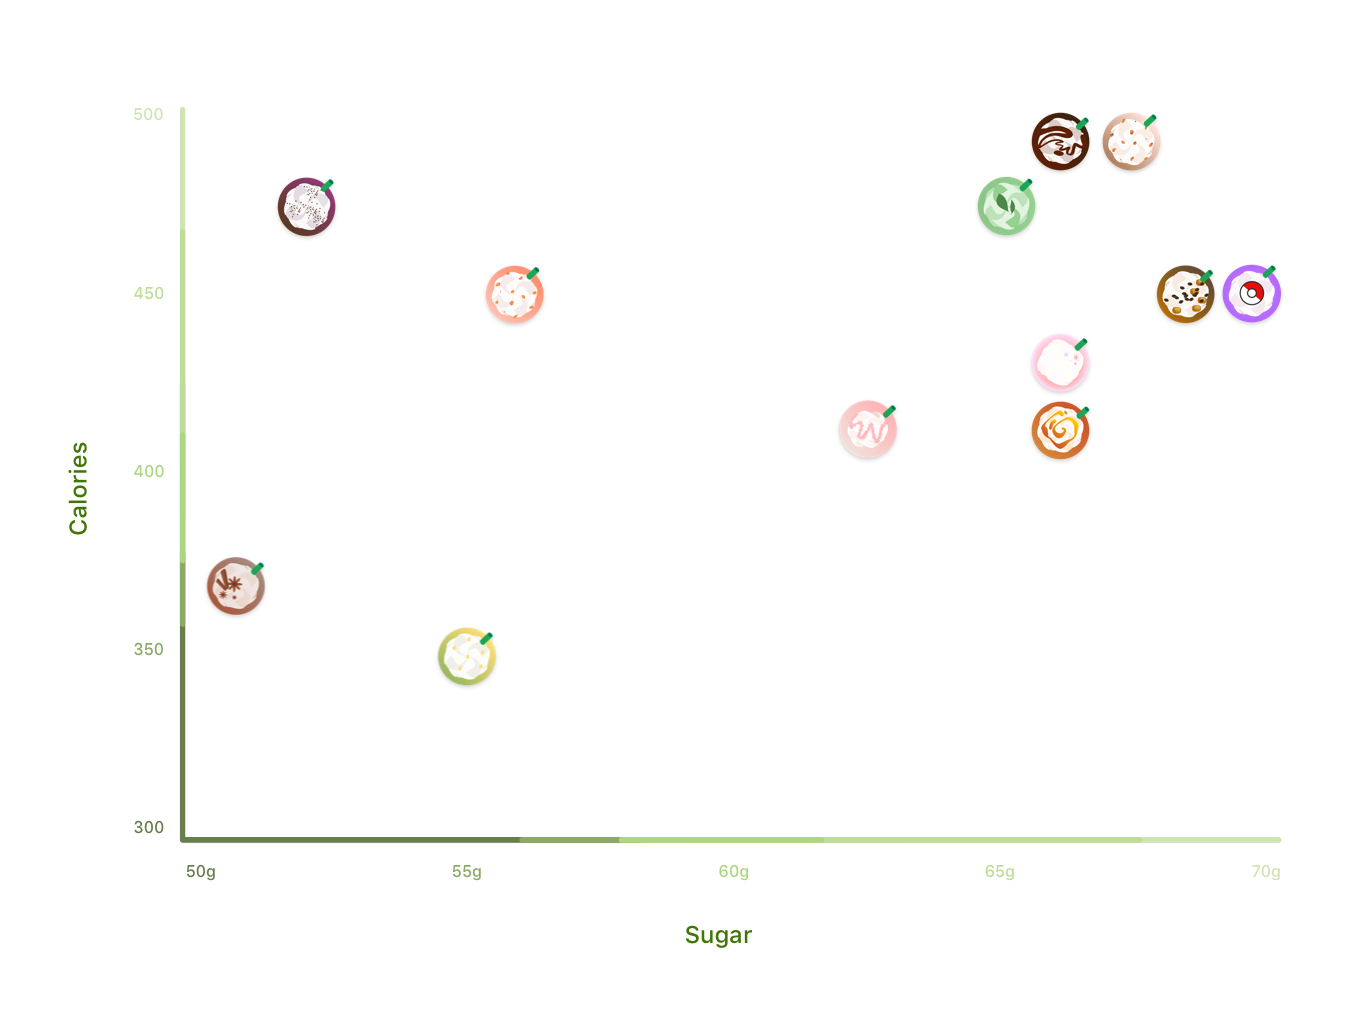

Sugar (The highest to lowest)

Calories (The highest to lowest)